You open your Shopify dashboard on a Tuesday morning. Orders from the weekend look reasonable. Your best-selling product has decent views. A new collection you launched last month is getting clicks.
But something feels off. Revenue this quarter is basically flat. You cannot pinpoint why.
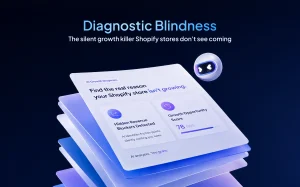
This is not a traffic problem or a budget problem. It is a direction problem. You have numbers in front of you, but none of them are telling you what to actually fix. That gap between measuring your store and understanding it is exactly where the idea of Shopify store diagnosis becomes worth paying attention to
Why Having Data Does Not Mean You Know What to Fix
Every Shopify store generates data constantly. Page views, time spent on a page, how often products get clicked, how many people actually complete a purchase. Merchants who use additional tools like Google Analytics or Klaviyo have even more layers to work through.
The problem is not a shortage of information. In fact, none of these tools connect the dots for you.
You can see that a product page has a low add-to-cart rate. But the data does not explain whether shoppers are confused by the product description, put off by the price, or simply arriving from the wrong audience. The number points to a symptom. It does not name the cause.
So merchants make their best guess, apply a fix, and wait to see if anything changes. Sometimes it works. Often it does not. Either way, the process is slow and reactive rather than strategic.
The Hidden Cost of Getting This Wrong
Here is what tends to happen when direction is missing. Merchants focus on what they can most visibly control: the product catalogue. A new bundle gets added. The hero image gets refreshed. A description gets rewritten.
These are not bad instincts. But they often address the wrong layer entirely.
Think about a store where the best customers, the ones who have spent the most and come back consistently, have quietly stopped purchasing. Nothing in the weekly dashboard flags this. Sales look acceptable because new customers are still trickling in. But the foundation of the business, its loyal base, is eroding in the background.
Or consider a store where a large portion of visitors browse products regularly but never add anything to their cart. The traffic numbers look fine. Engagement looks fine. But somewhere between viewing and buying, something is breaking down. Without knowing what that something is, every fix is a guess.
According to a Bain and Company study cited by Shopify, a five percent improvement in customer retention can increase profits by anywhere between twenty-five and ninety-five percent. Most stores are sitting on that opportunity without realising it.
The cost of missing problems like these does not always show up in a weekly dashboard review. Instead, it builds gradually and quietly across months of decisions made without the full picture..
What Traditional Shopify Analytics Can Tell You
To be clear, analytics tools earn their place. They record what has happened across your store and help you track change over time.
With Shopify's native reports, you can monitor sales by product, channel, or time period, conversion rates across collections and landing pages, average order value and how it shifts, the ratio of returning customers to new ones, and where shoppers drop off during checkout.
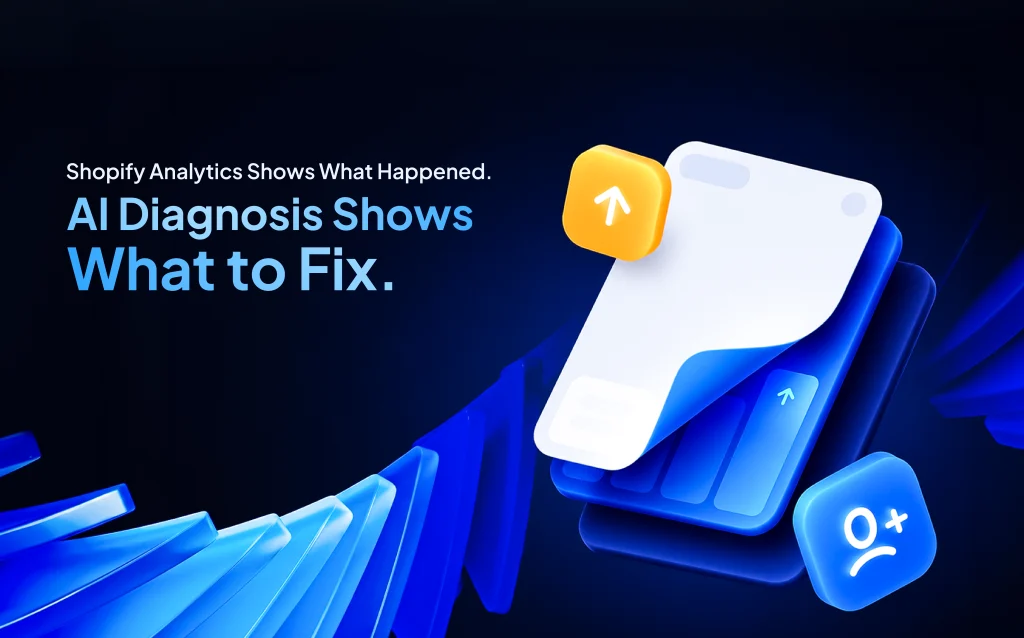
These measurements are real and useful. The issue, however, is that they answer one question, which is what happened, and stop there.
A dashboard can tell you that your conversion rate dropped over the past month. What it cannot tell you is whether that decline came from a pricing issue, a product gap, a change in who your promotions are reaching, or something else entirely. That second layer of understanding, the why, is where most analytics tools go quiet.
The Layer That Analytics Cannot Give You
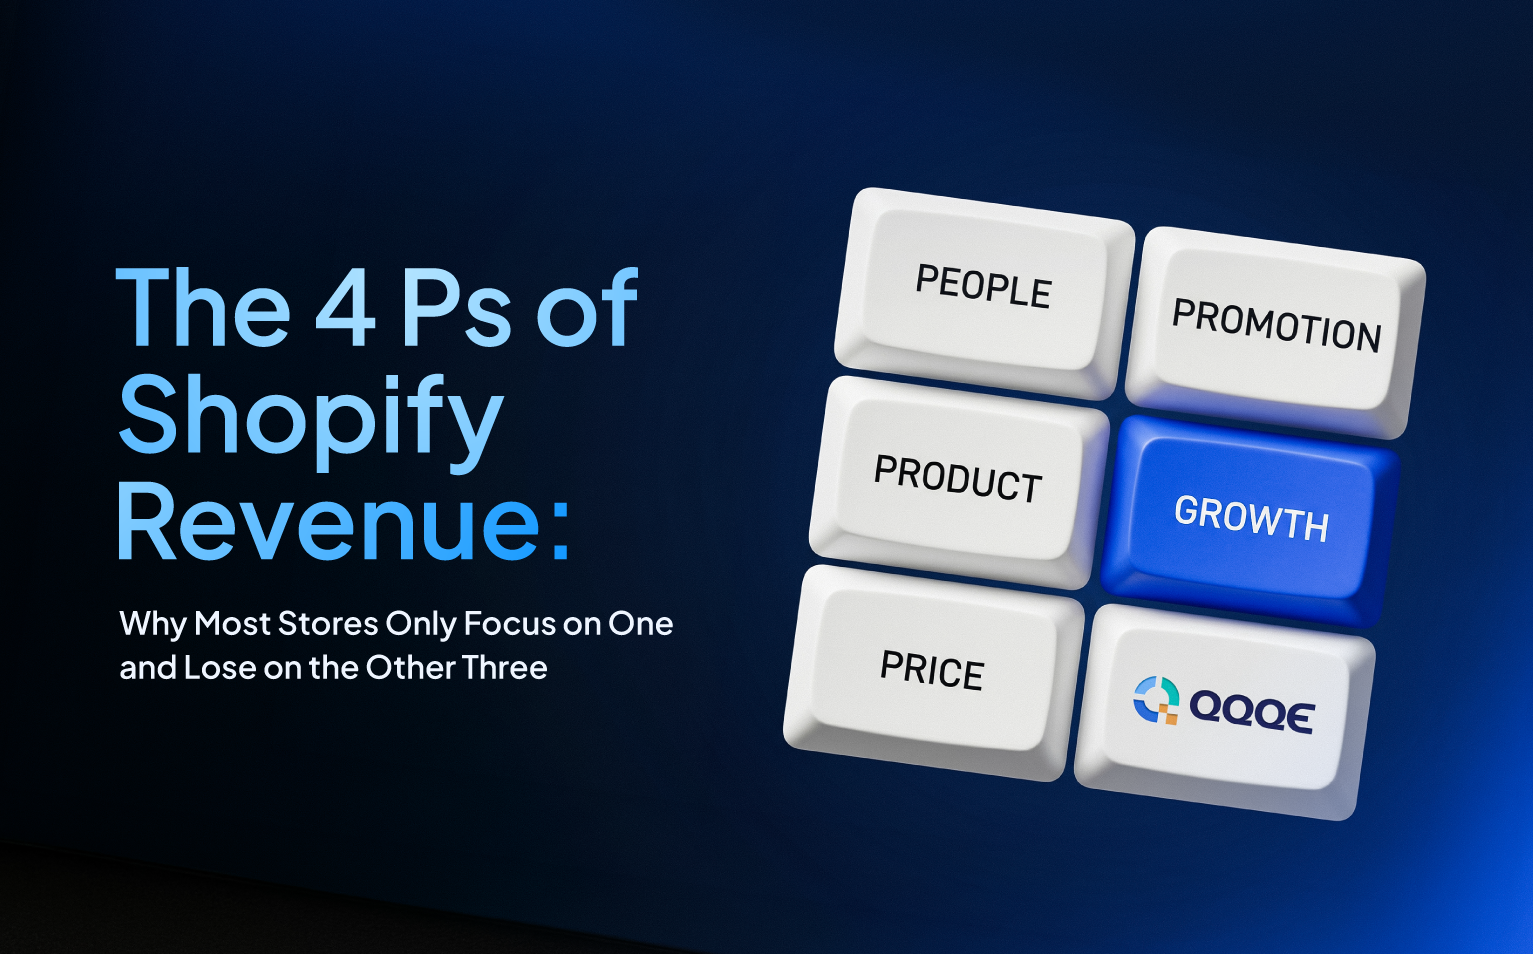
Every revenue problem in a Shopify store traces back to one or more of four dimensions: Product, People, Promotion, and Price. Analytics might hint at one of them. But it rarely shows you how they connect, and it almost never tells you which one to fix first.
Product
examines which items are genuinely earning their place in your catalogue and which ones are quietly dragging performance down. Some products attract plenty of attention but rarely convert. Others have never sold at all. Both are problems worth knowing about.
People
maps how customers actually behave in your store. Are visitors browsing without buying? Have your best customers gone quiet? Are there patterns in when your store gets the most traffic that you are not taking advantage of? This dimension surfaces the behavioural signals that a standard dashboard simply does not flag.
Promotion
looks at what is genuinely driving purchases versus what is pulling shoppers close but not quite converting them. Abandoned checkouts live here, and so does the question of whether your repeat customers are actually spending more over time or plateauing.
Price
examines whether your pricing is working with your customers or against them. Sometimes an entire price range is underperforming without anyone noticing. Sometimes customers are reaching checkout and leaving because the value does not feel right to them.
Any one of these dimensions can be the source of a problem. Often two or three of them interact. Viewing them together is the only way to understand what is actually limiting growth. And that is precisely what a standard analytics tool was never built to do.
This Is Where QQQE Changes the Equation
QQQE is an AI Growth Advisor for Shopify merchants. It connects to your store, analyses all four dimensions simultaneously, and benchmarks your performance against similar businesses in the same category. That benchmark is what gives each finding its weight. A conversion rate that seems low in isolation might be completely normal for your market. Or it might confirm exactly the gap you suspected. Either way, you are no longer measuring yourself against nothing.
From that analysis, QQQE surfaces up to 17 revenue blockers, each ranked as Critical, Medium, or Minor. Every blocker comes with a plain-language explanation and a ready-to-act solution. No interpretation needed on your end.
Two Quick Wins come with every cycle. One is tied to your chosen priority focus. The other reflects the most pressing opportunity the current diagnosis has found. Both are specific to your store.
Setup takes roughly two minutes. The first full diagnosis lands within 24 hours. Every seven days, the analysis runs again so the guidance stays relevant as your store evolves.
That is the difference between a reporting tool and a growth advisor. One tells you what happened. The other tells you what to do next.
If Your Store Should Be Growing Faster, This Is Why It Is Not
Most underperforming Shopify stores are not missing data. Rather, they are missing the layer that sits between the data and the decision.
Analytics tells you a number changed. It does not tell you why. Nor does it tell you which of the possible causes is the real one. It does not rank your problems by revenue impact or hand you a solution you can act on today.
That gap is where growth stalls. Quietly, consistently, week after week.
If that sounds familiar, the answer is not a new dashboard. It is a diagnosis.
Install QQQE from the Shopify App Store and get your first store diagnosis within 24 hours, or explore what it does at qqqe.io first.
Frequently Asked Questions
Q.1 What is Shopify store diagnosis?
It is an analysis of your store that goes beyond metrics. It identifies why performance is suffering, which problems are most critical, and what to fix first.
Q.2 How is AI store diagnosis different from Shopify analytics?
Analytics records what happened. AI store diagnosis explains why and tells you what to do about it, with each issue ranked by severity and paired with a solution.
Q.3 Does QQQE replace my existing analytics tools?
No. QQQE works alongside your analytics. It adds the layer of interpretation and prioritisation that reporting tools do not provide on their own.
Q.4 How long does a store diagnosis take?
With QQQE, the full analysis completes within 24 hours of installation. Setup takes roughly two minutes, and the diagnosis refreshes every seven days.
Q.5 Is AI store diagnosis useful for smaller Shopify stores?
Especially so. Smaller stores benefit most from knowing exactly where to focus because a wrong decision costs more when resources are limited. Clear priorities matter more as teams get leaner.